[CONSOLIDATED] El Nino and Haze Discussions

You prefer to WFH or Work on Site under Hazy Condition


  • Total voters
    172

WussRedXLi

Greater Supremacy Member
Joined
Jun 15, 2001
Messages
95,846
Reaction score
11,875
[Consolidated] 2015 El Nino and Haze Discussionss - Part 3

Starting an information tread regarding 2015 El Nino and Indonesian Haze.

Stay tuned for the latest info.....


This is the sister thread of the Air Purifier? thread, but that one got shifted to Home Décor & Furnishings.
Thread is here if you are interested :
http://forums.hardwarezone.com.sg/home-decor-furnishings-188/air-purifier-4604929-306.html

This thread would contain the latest weather information with regards to El Nino 2015, and also Indonesian Haze.


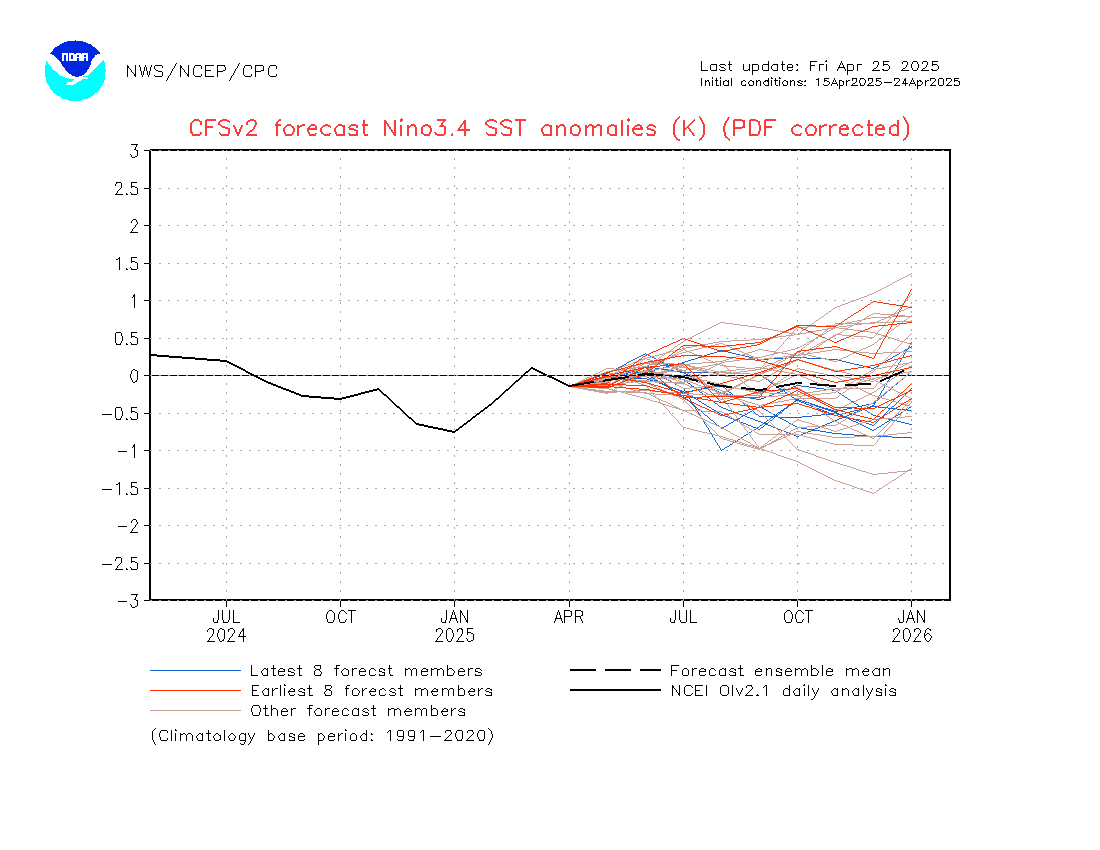
El Nino 2015 data

Nino regions
nino-regions.gif


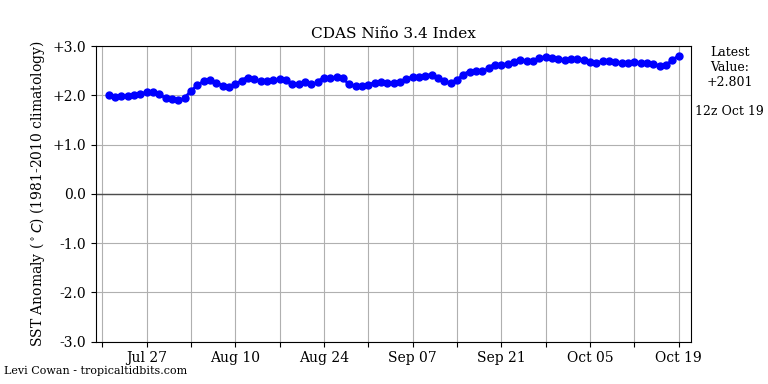
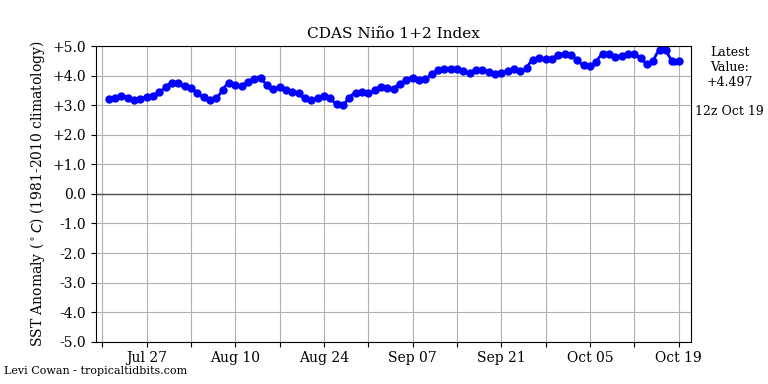
The key area to take note of is Nino 3.4, the key area in which the intensity of an El Nin is based on by scientists/weather folks. But this doesn't mean that Nino 3 isn't of interest as well, its huge size means that it also extends a great effect. Nino 1+2 is a small region, but is also gives you an idea on the SSTs off S America. In a classic El Nino during its peak and matured stage, all the warm water is piled up in the eastern pacific ocean off the coast of S America. A good portion of it may be in the central pacific as well.

SSTs / Sea Surface Temperatures

nino4.png


nino34.png


nino3.png


nino12.png


Sea surface winds (take particular note of the second diagram that shows the Anomalies)


In a normal situation, the trade winds blows from East to West at the equator in the Pacific ocean. ie easterlies. On a wind map, this means "right to left" arrows to the layman.
For an El Nino to form and sustain, we'd need the wind to blow the opposite direction, from West to East. The stronger the westerlies (wind coming from the west) blows, the more "juice" the El Nino gets because more water would flow to the East towards S America. This is a very layman explanation, the processes are deeper than this.
Just that it that we'd need a lot of these "westerlies". We can call these Westerly Wind Bursts.

[img]http://www.pmel.noaa.gov/tao/jsdisplay/plots/gif/sst_wind_anom_5day_ps32.gif


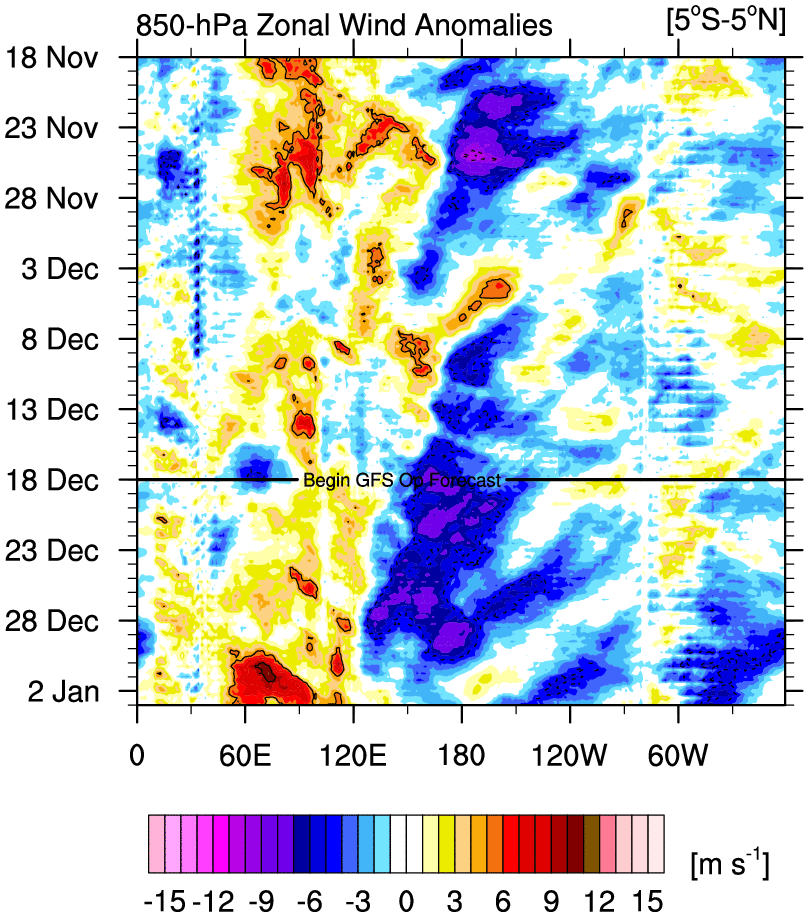
Looking at the diagram below, Westerly Wind Bursts are indicated by orange, red and pink. Pink is the highest intensity winds. These WWBs are needed for the El Nino to form, the stronger it is, the more intense it would get. Blue shades indicate Easterly winds, this is counter-productive for an El Nino formation.
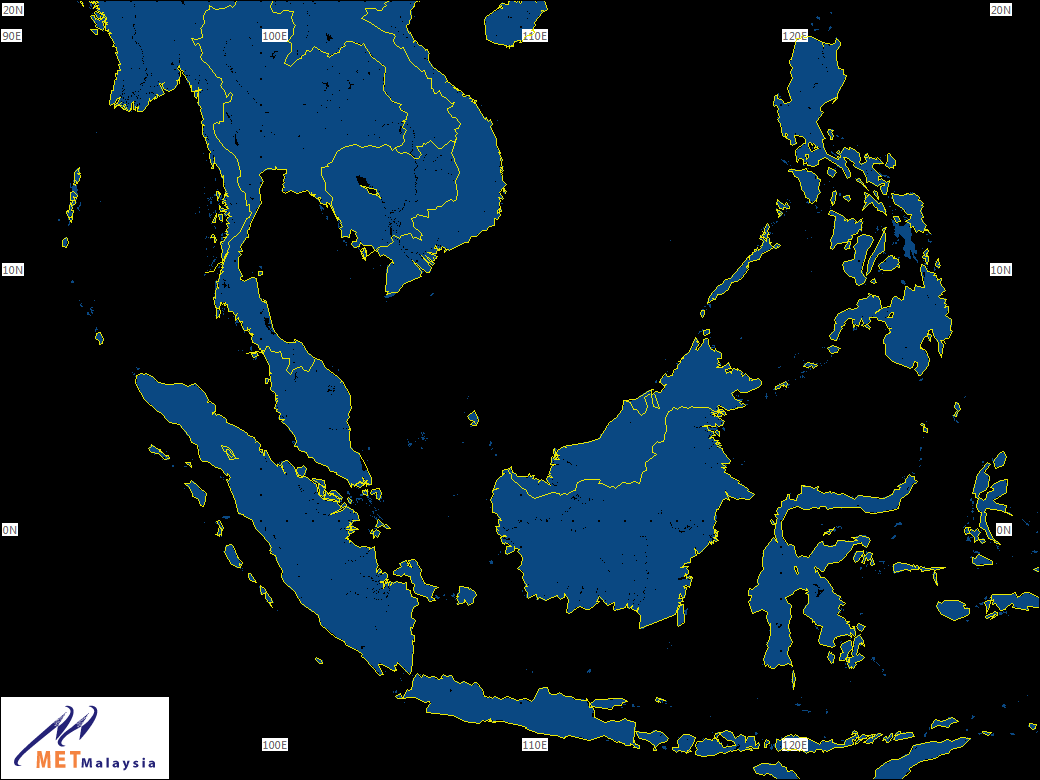
The "forecast" line indicates current date, below the line is the forecasted winds for the next week or so. Horizontal X axis is the longtitude. 180 = international date line. 80W is S America. 100E is Singapore. Papua New Guinea is 135E. Generally, we'd want westerly wind bursts to happen from about 135E all the way to near 80W S America, for the El Nino to strengthen. For the weather geeks, 135E is the start of the Kelvin Wave Generation Area (KWGA)

You can compare the longtitudes against the world map depicted in the last picture, if you want to know the location of the winds.
u.anom.30.5S-5N.gif


Overall view :


cdas-sflux_ssta_global_1.png
 

WussRedXLi

Greater Supremacy Member
Joined
Jun 15, 2001
Messages
95,846
Reaction score
11,875
HAZE


1-hr PM2.5 concentration readings and historical data

http://fuzzyview.neocities.org

Special thanks to bro Chuanz for doing up the above webby, damn pro!

Above 1-hr PM2.5 data taken from NEA
https://www.haze.gov.sg/resources/1-hr-pm2.5-readings


In the above link, there are regions for North, South, East, West and Central. There is also an average figure, which gives you the average of the hourly data points. At the end of the day, you'd have a 24-hr average PM2.5 figure.

24-hr PM2.5 concentration of 55.5 ug/m3 = 24-hr PSI 100 (Same thing as you'd see on NEA for the 24-hr figure)

The US Environmental Protection Agency (EPA) states that a 24hr figure of > 35 ug/m3 PM2.5 = Unhealthy for people in the Sensitive group. That corresponds to a 24-hr PSI 78 and above.

(eg, people with allergies, asthma, COPD, elderly, pregnant, infants and kids below age 6 whose respiratory system is still developing etc). Some groups are more susceptible than others, eg those with lung, heart and stroke risks and issues.
Note : Very short duration spikes in PM2.5 of just 15 mins may trigger symptoms for some groups who are very sensitive/susceptible.

WHO recommends not to have a 24-hr exposure to PM2.5 of more than 25 ug/m3. That corresponds to a 24-hr PSI value of PSI 65 and above.


Japan Air Quality Standard for PM2.5
The 24 hour standard, which means the annual 98th percentile values at designated monitoring sites in an area, is less than or equal to 35μg/m3. (NOTE : 24hr avg 35ug/m3 = 24hr PSI 78)
Source : https://www.env.go.jp/en/air/aq/aq.html

Below are AQI values (not our PSI). As what you'd see on aqicn.org

Another country that implements this :


Victoria, Australia
http://www.epa.vic.gov.au/air/bulletins/aqbhour.asp?fl=-1&s=1&dt=1
xzbSdcT.jpg


1hr and 8hr US Wildfire smoke exposure guidelines
FHWQSfJ.jpg


Citra_Radar_PEKA.png

Citra_Radar_PALE.png

Citra_Radar_PONT.png

Citra_Radar_PANG.png

Citra_Radar_PALA.png
 
Last edited:

WussRedXLi

Greater Supremacy Member
Joined
Jun 15, 2001
Messages
95,846
Reaction score
11,875
PetaMonitoringHariTanpaHujan-Indonesia.jpg


FDRS FFMC / Fine Fuel Moisture Code. This mainly indicates the moisture levels of the top surface. If it has rained recently with a decent amount, it'd turn to blue.
The FFMC values shown on the map are numerical ratings of the moisture content of litter and other cured fine fuels. The FFMC indicates the relative ease of ignition and flammability of fine fuels. Thus, the FFMC is used as an indicator of ignition potential or the potential for fires to start and spread in the area. (Fine Fuels: Slash fuels, grassland, lalang, bushes etc).


FFMC.png


DC.png


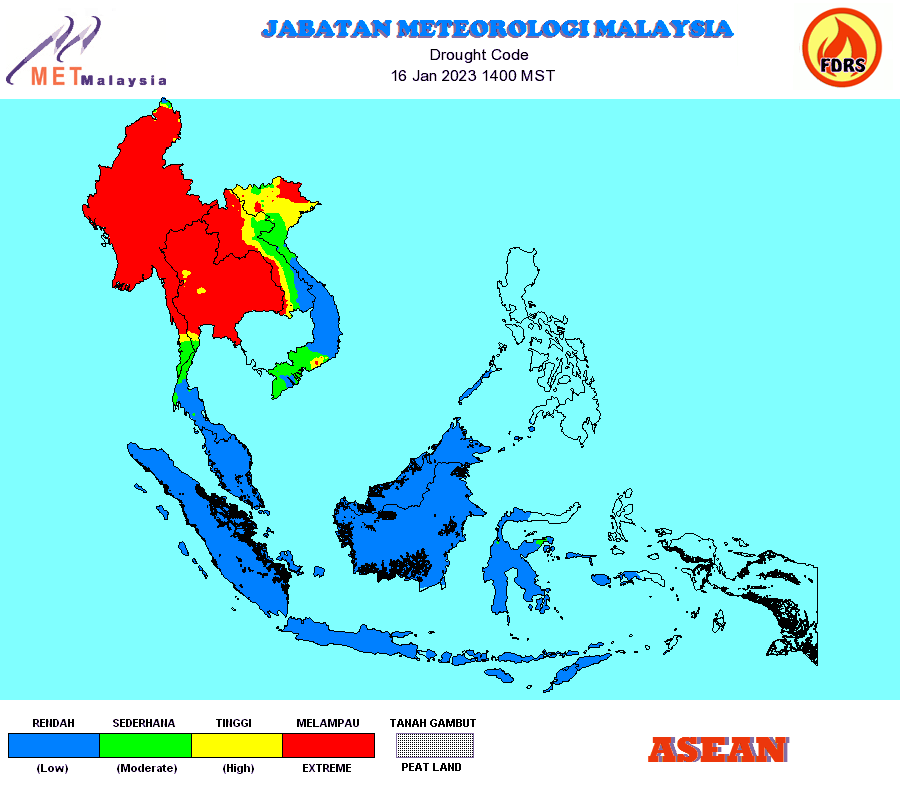
FDRS DC / Drought Code

The DC values shown on the map are indicative values of the moisture content of a deep layer of compact organic matter. Peat soil is an example of deep compact organic soil. The DC is used to indicate the potential for fire to smoulder in peat which is the primary cause of smoke and haze in Southeast Asia. It can also be used as an indicator of difficulty in extinguishing deep burning peat fires as well as an early warning indicator of serious haze events.


Credit to BMKG

Jambi
jambi_ffmcobs.jpg


S Sumatra
sumsel_ffmcobs.jpg


abpwsair.jpg
 
Last edited:

WussRedXLi

Greater Supremacy Member
Joined
Jun 15, 2001
Messages
95,846
Reaction score
11,875
http://www.arb.ca.gov/carpa/toolkit/data-to-mes/wildfire-smoke-guide.pdf

Sensitive populations

Most healthy adults and children will recover quickly from smoke exposure and will not suffer long-term consequences. However, certain sensitive populations may experience more severe short-term and chronic symptoms. Much of the information about how particulate matter affects these groups has come from studies involving airborne particles in cities, though a few studies examining the effects of exposure to smoke suggest that the health effects of wildfire smoke are likely to be similar (Naeher et al. 2007). More research is needed to determine whether particles from wildfires affect susceptible subpopulations differently.

Individuals with asthma and other respiratory diseases. More than 35 million people in the US suffer from chronic lung diseases such as asthma and chronic obstructive pulmonary disease (COPD) (American Lung Association 2008). Levels of pollutants that may not affect healthy people may cause breathing difficulties for people with asthma, COPD, or other chronic lung diseases. Asthma is a condition characterized by chronic inflammation of the bronchi and smaller airways, with intermittent airway constriction, causing shortness of breath, wheezing, chest tightness, and coughing, sometimes accompanied by excess mucus production. During an asthma attack, the muscles tighten around the airways and the lining of the airways becomes inflamed and swollen, constricting the free flow of air. Because children’s airways are narrower than those of adults, irritation that might create minor problems for an adult may result in significant obstruction in the airways of a young child. However, this disease affects all age groups: the highest mortality rates from asthma occur among older adults.

A significant fraction of the population may have airway hyperresponsiveness, an exaggerated tendency of the large and small airways (bronchi and bronchioles, respectively) to constrict in response to respiratory irritants, cold dry air, and other stimuli. While airway hyperresponsiveness is considered a hallmark of asthma, this tendency may also be found in many individuals without asthma as well; for example, during and following a lower respiratory tract infection. In such individuals, smoke exposure may cause asthma-like symptoms.

Individuals with COPD, which is generally considered to encompass emphysema and chronic bronchitis, may also experience worsening of their conditions because of exposure to wildfire smoke. Patients with COPD often have an asthmatic component to their condition, which may result in their experiencing asthma-like symptoms. However, because their lung capacity has typically been seriously compromised, additional constriction of the airways in individuals with COPD may result in symptoms requiring medical attention. Researchers have reported that individuals with COPD run an increased risk of requiring emergency medical care after exposure to particulate matter or forest fire smoke. Exposure to smoke may also depress the lung’s ability to fight infection. People with COPD may develop lower respiratory infections after exposure to wildfire smoke, which may require urgent medical care as well. In addition, because COPD is usually the result of many years of smoking, individuals with this condition may also have heart disease, and are potentially at risk from both conditions.

Individuals with cardiovascular disease. Diseases of the circulatory system include high blood pressure, cardiovascular diseases, such as coronary artery disease and congestive heart failure, and cerebrovascular conditions, such as hardening of the arteries (atherosclerosis) that bring blood to the brain. These chronic conditions can render individuals susceptible to attacks of angina pectoris (transient chest pain), heart attacks, sudden death due to a cardiac arrhythmia, acute congestive heart failure, or stroke. Cardiovascular diseases are the leading cause of mortality in the United States: about 30 to 40 percent of all deaths each year. The vast majority of these deaths occur in people over age 65. Studies have linked urban particulate matter to increased risks of heart attacks, cardiac arrhythmias, and other adverse effects in those with cardiovascular disease. People with chronic lung or heart disease may experience one or more of the following symptoms: shortness of breath, chest tightness, pain in the chest, neck, shoulder or arm, palpitations, or unusual fatigue or lightheadedness. Chemical messengers released into the blood because of particle-related lung inflammation may increase the risk of blood clot formation, angina episodes, heart attacks, and strokes.

The elderly. Researchers have estimated that tens of thousands of elderly people die prematurely each year from exposure to particulate air pollution, as older adults are more likely to have pre-existing lung and heart diseases, and therefore are more susceptible to particle-associated effects. The elderly may also be more affected than younger people because important respiratory defense mechanisms decline with age. Particulate air pollution can compromise the function of cells involved in immune defenses in the lungs, potentially increasing susceptibility to bacterial or viral respiratory infections, which may carry a worse prognosis in older adults.

Children. Children, even those without any pre-existing illness or chronic conditions, are considered a sensitive population because their lungs are still developing, making them more susceptible to air pollution than healthy adults. Several factors lead to increased exposure in children compared with adults: they tend to spend more time outside; they engage in more vigorous activity; and they inhale more air (and therefore more smoke constituents) per pound of body weight. These are all reasons to try to limit children’s vigorous outdoor activities during smoky conditions. Studies have shown that particle pollution is associated with increased respiratory symptoms and decreased lung function in children, including symptoms such as episodes of coughing and difficulty breathing. These can result in school absences and other limitations of normal childhood activities.

Pregnant women. While there have not been studies of the effects of exposure to wildfire smoke on pregnancy outcomes, there is substantial evidence of adverse effects of repeated exposures to cigarette smoke, including both active and passive smoking. Wildfire smoke contains many of the same compounds as cigarette smoke. In addition, recent data suggest that exposures to ambient air pollution in cities may result in low birth weight, preterm birth, and possibly other more serious adverse reproductive effects, including infant mortality. Therefore, it would be prudent to consider pregnant women as a potentially susceptible population as well.

Smokers. People who smoke, especially those who have smoked for many years, have compromised lung function. However, due to adaptation of their lungs to ongoing irritation, smokers are generally less likely to report symptoms from exposure to irritant chemicals than are nonsmokers. Nevertheless, they may still be injured by wildfire smoke. Therefore, because they may not experience the same degree of irritation from wildfire smoke as nonsmokers, some smokers may unwittingly put themselves at greater risk of potentially harmful wildfire smoke exposures.


Last edited:

linusz

Master Member
Joined
Jul 10, 2001
Messages
3,035
Reaction score
107
Going out to buy breakfast
So far only me don mask

Why the pp buy keep and don't use
 

tmkedmw

Banned
Joined
Feb 16, 2013
Messages
34,297
Reaction score
24,501
Judging from yesterday's haze cloud map at 7pm, and without waiting for the availability of sat pics, I think there is no respite at least for the next few hours.

Kali haze is what we are currently experiencing.
 
Important Forum Advisory Note
This forum is moderated by volunteer moderators who will react only to members' feedback on posts. Moderators are not employees or representatives of HWZ Forums. Forum members and moderators are responsible for their own posts. Please refer to our Community Guidelines and Standards and Terms and Conditions for more information.
Top