WussRedXLi
Greater Supremacy Member
- Joined
- Jun 15, 2001
- Messages
- 95,740
- Reaction score
- 11,792
[Consolidated] 2015 El Nino and Haze Discussionss - Part 3
Starting an information tread regarding 2015 El Nino and Indonesian Haze.
Stay tuned for the latest info.....
This is the sister thread of the Air Purifier? thread, but that one got shifted to Home Décor & Furnishings.
Thread is here if you are interested :
http://forums.hardwarezone.com.sg/home-decor-furnishings-188/air-purifier-4604929-306.html
This thread would contain the latest weather information with regards to El Nino 2015, and also Indonesian Haze.
El Nino 2015 data
Nino regions

The key area to take note of is Nino 3.4, the key area in which the intensity of an El Nin is based on by scientists/weather folks. But this doesn't mean that Nino 3 isn't of interest as well, its huge size means that it also extends a great effect. Nino 1+2 is a small region, but is also gives you an idea on the SSTs off S America. In a classic El Nino during its peak and matured stage, all the warm water is piled up in the eastern pacific ocean off the coast of S America. A good portion of it may be in the central pacific as well.
SSTs / Sea Surface Temperatures


Sea surface winds (take particular note of the second diagram that shows the Anomalies)
In a normal situation, the trade winds blows from East to West at the equator in the Pacific ocean. ie easterlies. On a wind map, this means "right to left" arrows to the layman.
For an El Nino to form and sustain, we'd need the wind to blow the opposite direction, from West to East. The stronger the westerlies (wind coming from the west) blows, the more "juice" the El Nino gets because more water would flow to the East towards S America. This is a very layman explanation, the processes are deeper than this.
Just that it that we'd need a lot of these "westerlies". We can call these Westerly Wind Bursts.
[img]http://www.pmel.noaa.gov/tao/jsdisplay/plots/gif/sst_wind_anom_5day_ps32.gif
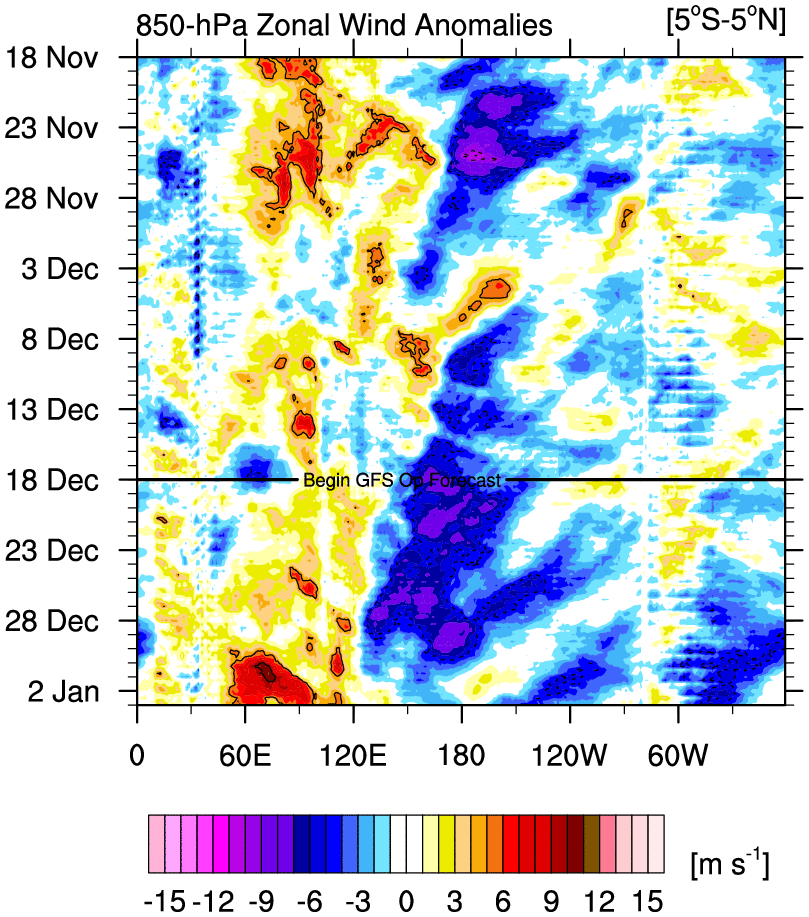
Looking at the diagram below, Westerly Wind Bursts are indicated by orange, red and pink. Pink is the highest intensity winds. These WWBs are needed for the El Nino to form, the stronger it is, the more intense it would get. Blue shades indicate Easterly winds, this is counter-productive for an El Nino formation.
The "forecast" line indicates current date, below the line is the forecasted winds for the next week or so. Horizontal X axis is the longtitude. 180 = international date line. 80W is S America. 100E is Singapore. Papua New Guinea is 135E. Generally, we'd want westerly wind bursts to happen from about 135E all the way to near 80W S America, for the El Nino to strengthen. For the weather geeks, 135E is the start of the Kelvin Wave Generation Area (KWGA)
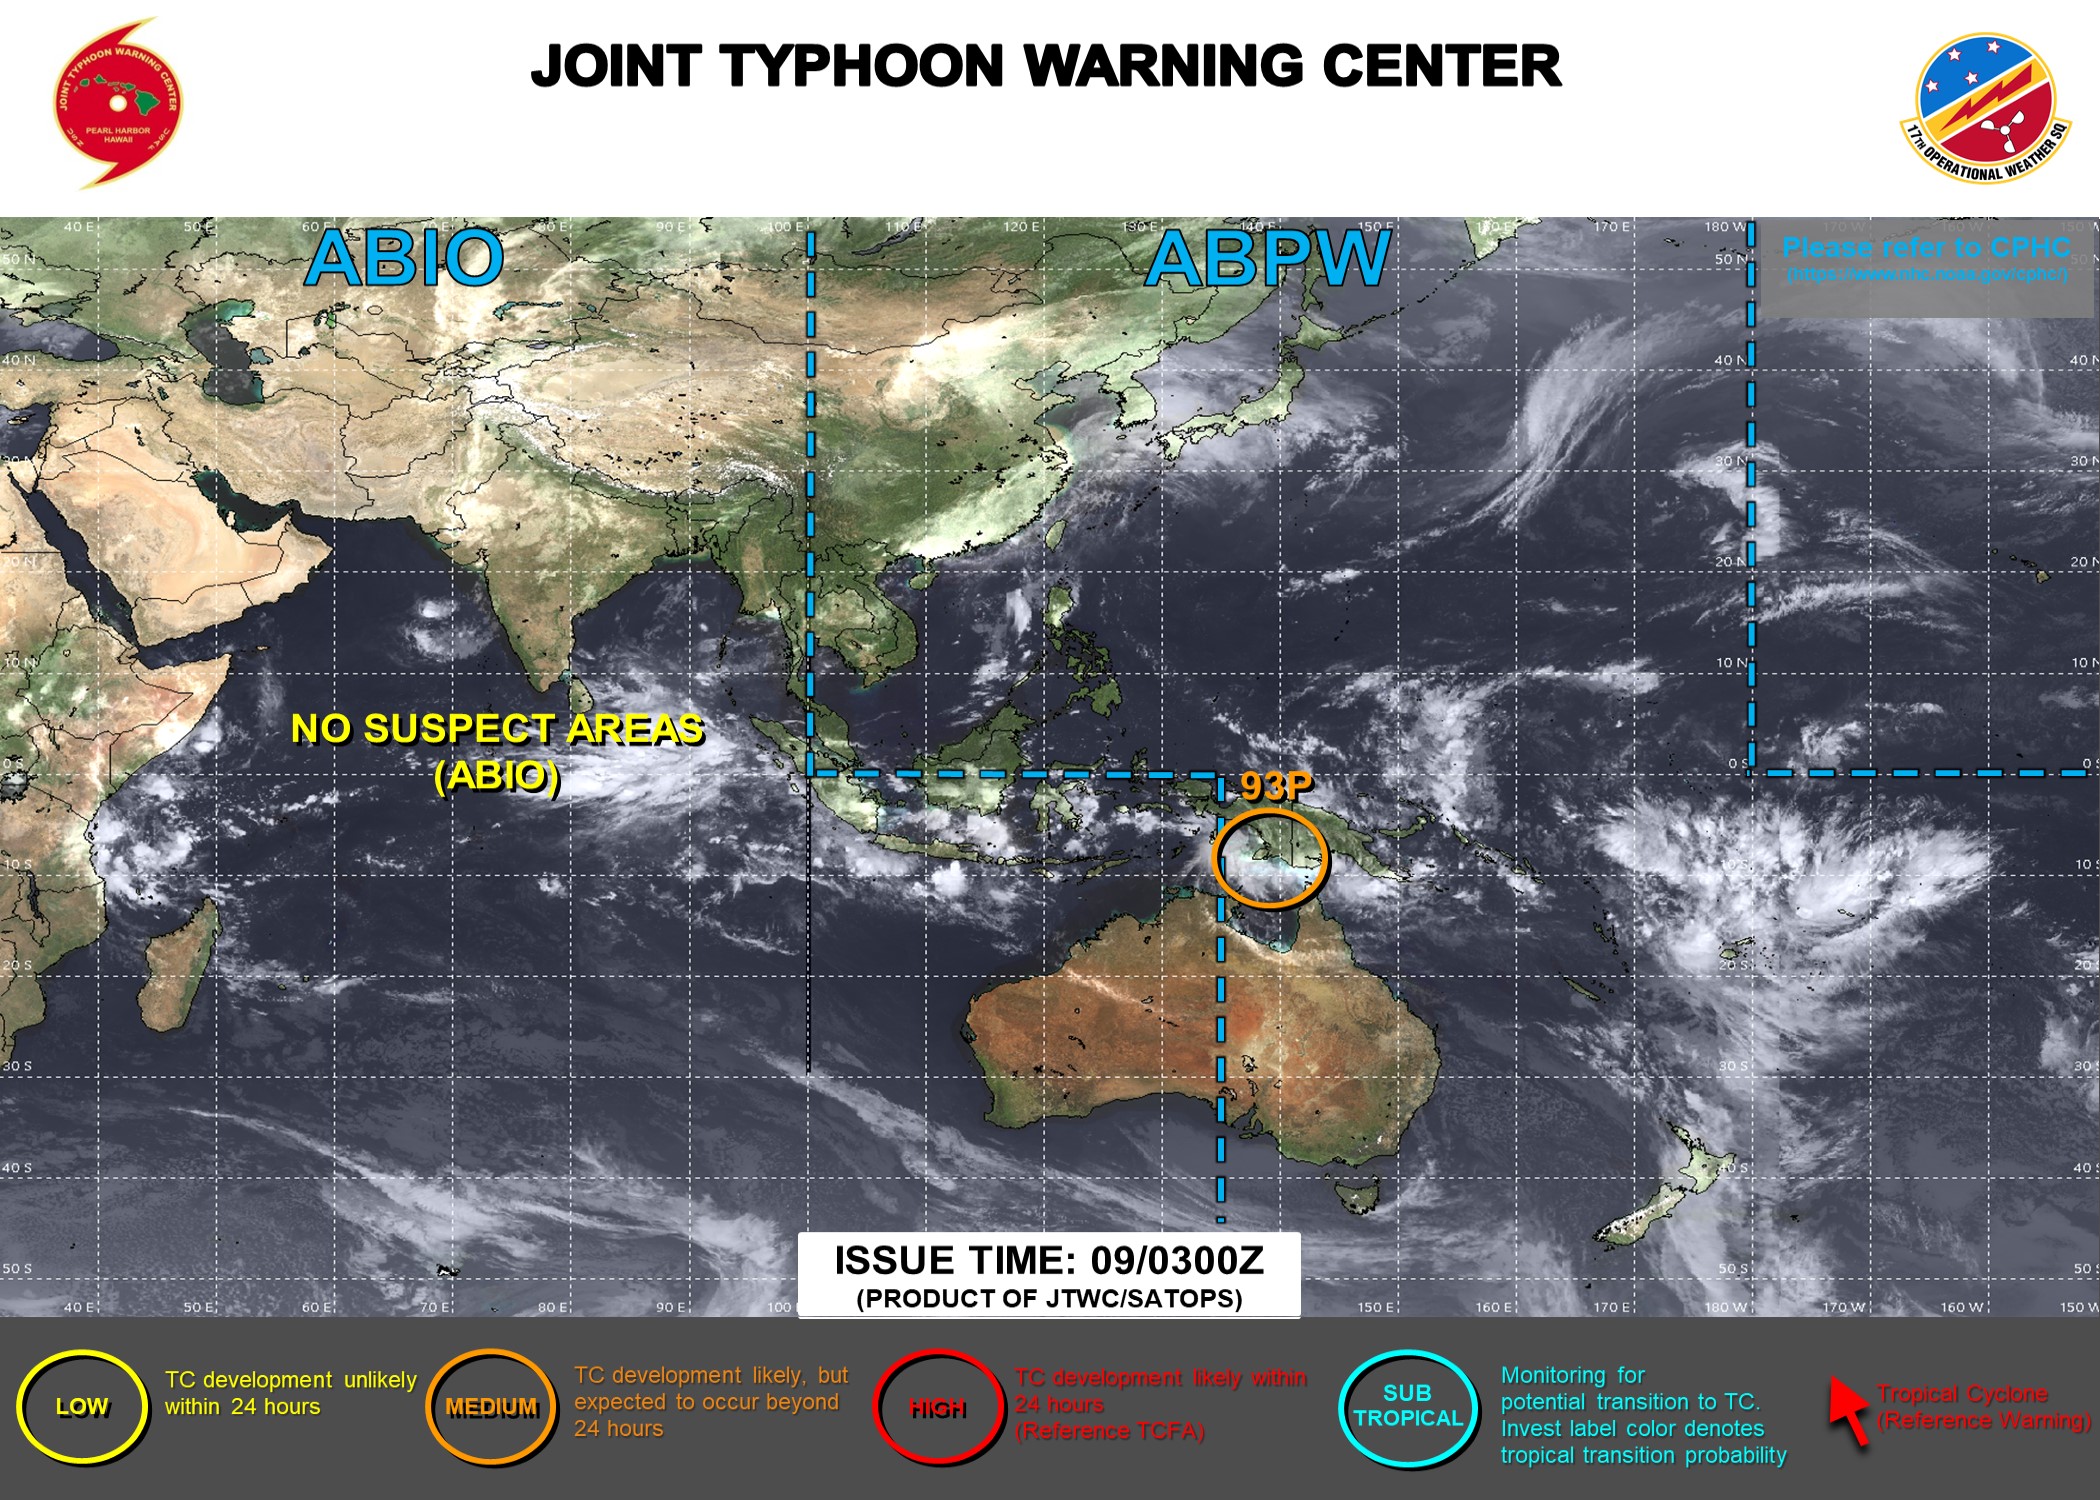
You can compare the longtitudes against the world map depicted in the last picture, if you want to know the location of the winds.
Overall view :

Starting an information tread regarding 2015 El Nino and Indonesian Haze.
Stay tuned for the latest info.....
This is the sister thread of the Air Purifier? thread, but that one got shifted to Home Décor & Furnishings.
Thread is here if you are interested :
http://forums.hardwarezone.com.sg/home-decor-furnishings-188/air-purifier-4604929-306.html
This thread would contain the latest weather information with regards to El Nino 2015, and also Indonesian Haze.
El Nino 2015 data
Nino regions
The key area to take note of is Nino 3.4, the key area in which the intensity of an El Nin is based on by scientists/weather folks. But this doesn't mean that Nino 3 isn't of interest as well, its huge size means that it also extends a great effect. Nino 1+2 is a small region, but is also gives you an idea on the SSTs off S America. In a classic El Nino during its peak and matured stage, all the warm water is piled up in the eastern pacific ocean off the coast of S America. A good portion of it may be in the central pacific as well.
SSTs / Sea Surface Temperatures
Sea surface winds (take particular note of the second diagram that shows the Anomalies)
In a normal situation, the trade winds blows from East to West at the equator in the Pacific ocean. ie easterlies. On a wind map, this means "right to left" arrows to the layman.
For an El Nino to form and sustain, we'd need the wind to blow the opposite direction, from West to East. The stronger the westerlies (wind coming from the west) blows, the more "juice" the El Nino gets because more water would flow to the East towards S America. This is a very layman explanation, the processes are deeper than this.
Just that it that we'd need a lot of these "westerlies". We can call these Westerly Wind Bursts.
[img]http://www.pmel.noaa.gov/tao/jsdisplay/plots/gif/sst_wind_anom_5day_ps32.gif
Looking at the diagram below, Westerly Wind Bursts are indicated by orange, red and pink. Pink is the highest intensity winds. These WWBs are needed for the El Nino to form, the stronger it is, the more intense it would get. Blue shades indicate Easterly winds, this is counter-productive for an El Nino formation.
The "forecast" line indicates current date, below the line is the forecasted winds for the next week or so. Horizontal X axis is the longtitude. 180 = international date line. 80W is S America. 100E is Singapore. Papua New Guinea is 135E. Generally, we'd want westerly wind bursts to happen from about 135E all the way to near 80W S America, for the El Nino to strengthen. For the weather geeks, 135E is the start of the Kelvin Wave Generation Area (KWGA)
You can compare the longtitudes against the world map depicted in the last picture, if you want to know the location of the winds.
Overall view :