don't think that's how u use CAPE ratio to predict future expected returns lah.
https://www.gurufocus.com/shiller-PE.php?width=362&height=217
or whether they backtest the data and apply monte carlo simulation, idk.
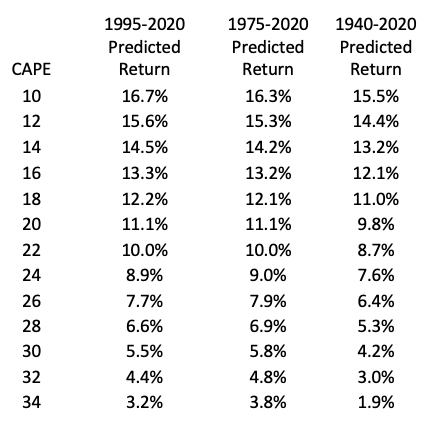
like the article u cited said, it's not really meant to use to time the market, but rather to forecast the expected returns over a probabilistic range based on backtested data. future earnings is an unknown variable, but over a long period of time it should not deviate too much away from historical average. eg; AI may increase EPS growth (like say 10% pa to 13% pa), but can it raise EPS growth to the point where all past models are thrown out of the window, like 30% EPS growth consistently, and the US economy will grow at 4% annually vs 2% currently?
it's like i cannot reliably predict whether it will rain next week of not. but based on historical data, i know it rains on average 4x a month. if it has been already raining for 6x for the past 3 weeks, it is more unlikely to rain next week.
the lesson to take away is that valuation still matters, and there is pretty strong correlation to average future returns. if u believe valuations are a poor predictor of future average returns because some revolutionary tech will be invented and all past models can be thrown out of the window, then i also nothing to say liao.
im not using it to time the market (im still dca-ing into US mkt), but im just cognizant that my future average returns might not be as spectacular based on current valuations.
anyway, i think this is a pretty good read:
https://www.invesco.com/apac/en/ins...osophy-the-shiller-PE-and-SP-500-returns.html
Figure 2 – S&P 500 Shiller P/E and future returns since 1983
Figure 4 – Shiller P/E and S&P 500 10-year annualised forward returns since 1983