a562140
Supremacy Member
- Joined
- Mar 12, 2004
- Messages
- 6,412
- Reaction score
- 3
Wage and the Premier League scaled table
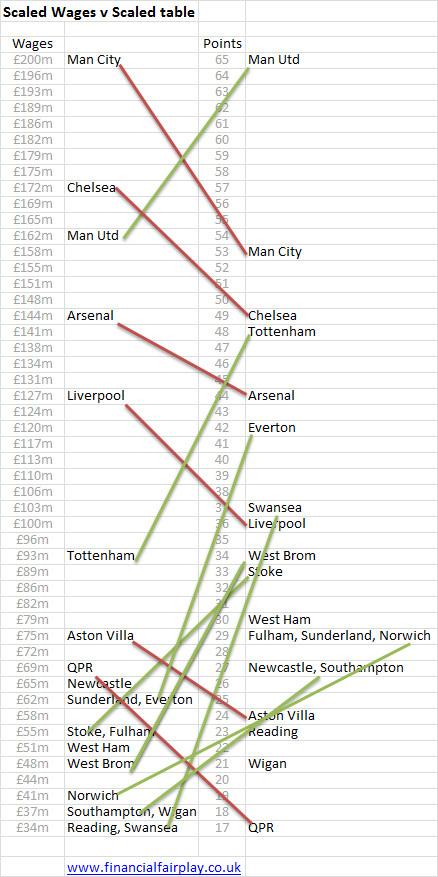
The right two columns represent the current league table drawn to scale. The wage costs (shown in the two left columns) are based on either, recently published wage costs for the 2011/12 season, or, where not available, an estimate of the wage bill.
The wage costs are highly polarised with Man City spending £200m on wages, whereas clubs like Swansea spend only around £35m. Manchester City's (and Chelsea's) spending generates a stretched table with only a few high wage-paying clubs at the top, but most of the clubs paying broadly similar wages around the lower part of the table.
The green and red lines show the clubs that have significantly over-performed (green line) or under-performed (red line) against their wages expenditure. Looking at the clubs who have most over-performed, we see:
Man Utd, Tottenham, Swansea, Everton, West Brom, Stoke, Norwich and Southampton
The stretching of the wages table has the effect of somewhat over-emphasising the achievements of the lower teams in the league table - however by any standards, these teams have all had a rather good season.
There are six teams that the table suggests have under-performed given the resources at their disposal:
Man City, Chelsea, Arsenal, Liverpool, Villa and QPR

