You are using an out of date browser. It may not display this or other websites correctly.
You should upgrade or use an alternative browser.
You should upgrade or use an alternative browser.
Forex Tradingwithrayner
- Thread starter tradingwithrayner
- Start date
More options
Who Replied?tradingwithrayner
Member
- Joined
- Apr 15, 2013
- Messages
- 383
- Reaction score
- 0
bro i wanna learn from you. maybe will start in 2 weeks time when i get my finances and bank accounts in order.
Can start with 500$?
which broker do you suggest?
Sure you can start with $500.
However i'd rather you start with a demo account to know what you're doing before risking any real money.
Cheers!
Knight_Rider
Arch-Supremacy Member
- Joined
- Apr 30, 2003
- Messages
- 11,100
- Reaction score
- 1
Looking to trade GBPUSD when it retrace to 1.67-1.672 with a profit target around 1.6780 to 1.6800 and a SL at around 1.6690.
Looking to buy GBP/JPY with the added benefit of Russian and Ukrainian foreign ministers meeting over the weekend with the aim of approaching a political ceasefire. Cheers.
Looking to buy GBP/JPY with the added benefit of Russian and Ukrainian foreign ministers meeting over the weekend with the aim of approaching a political ceasefire. Cheers.
Knight_Rider
Arch-Supremacy Member
- Joined
- Apr 30, 2003
- Messages
- 11,100
- Reaction score
- 1
Looking to trade GBPUSD when it retrace to 1.67-1.672 with a profit target around 1.6780 to 1.6800 and a SL at around 1.6690.
Looking to buy GBP/JPY with the added benefit of Russian and Ukrainian foreign ministers meeting over the weekend with the aim of approaching a political ceasefire. Cheers.
Cable kena hammered. Will drop further. Exiting the pending buy.
Cable kena hammered. Will drop further. Exiting the pending buy.
why not turn short instead?
Knight_Rider
Arch-Supremacy Member
- Joined
- Apr 30, 2003
- Messages
- 11,100
- Reaction score
- 1
why not turn short instead?
It's quite oversold and very near 23.6%. See how first. Yen crosses and Kiwi lotsof room to play I dun get stuck in one two pair.
It's quite oversold and very near 23.6%. See how first. Yen crosses and Kiwi lotsof room to play I dun get stuck in one two pair.
Yen cross chart is very nice! lost on Kiwi thou.
Knight_Rider
Arch-Supremacy Member
- Joined
- Apr 30, 2003
- Messages
- 11,100
- Reaction score
- 1
Yen cross chart is very nice! lost on Kiwi thou.
Kiwi very near support. Either you go for long term buy or sell on retracement. I am still bullish on kiwi due to great carry trade. Simple strategy on trending pairs quite easy.
tradingwithrayner
Member
- Joined
- Apr 15, 2013
- Messages
- 383
- Reaction score
- 0
Kiwi very near support. Either you go for long term buy or sell on retracement. I am still bullish on kiwi due to great carry trade. Simple strategy on trending pairs quite easy.
I'm with you on this.
After all loss is 1 R only.
tradingwithrayner
Member
- Joined
- Apr 15, 2013
- Messages
- 383
- Reaction score
- 0

Also traders may want to check out the Bund. Trending very well at the moment.

On Daily price is breaking new highs and momentum doesn’t seem to be stalling.

On 4hour we can see 149.40 is a key area as price tested twice previously
Long 149.30
SL 148.70
tradingwithrayner
Member
- Joined
- Apr 15, 2013
- Messages
- 383
- Reaction score
- 0
Is Eurusd Selloff Over?

On Daily we see bearish momentum to the downside with price breaking new lows.
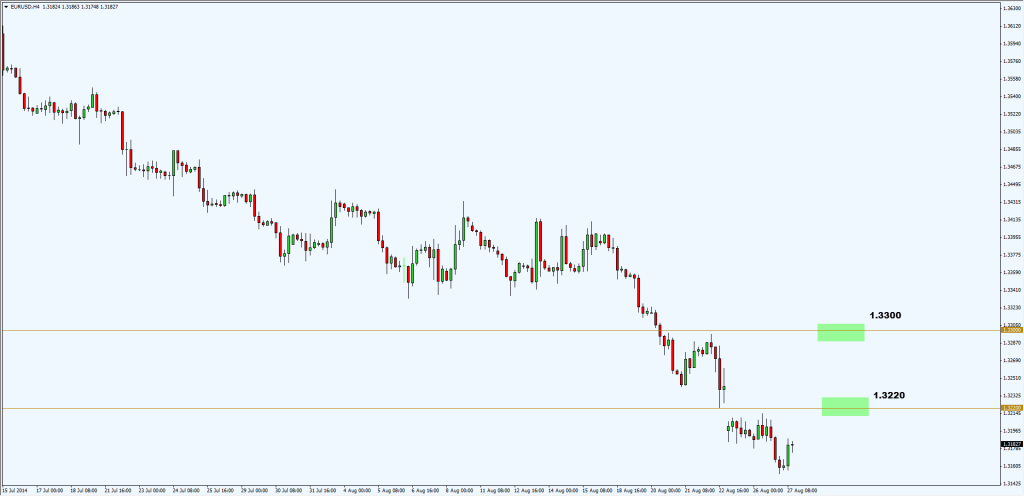
On 4 hour these are 2 areas I will be looking at should price retrace.
Short 1.3220
SL 1.3255
On Daily we see bearish momentum to the downside with price breaking new lows.
On 4 hour these are 2 areas I will be looking at should price retrace.
Short 1.3220
SL 1.3255
tradingwithrayner
Member
- Joined
- Apr 15, 2013
- Messages
- 383
- Reaction score
- 0
Have you actually made any profit?
Hi Rayner,
Cheers for helping out new traders.
I've been tracking your trades.
They seem to be mostly losses, but I may be wrong because you don't show the historical or live trades on your chart like this one.
Can you post your historical and live trades plotted on your chart as below so we know where you got in and got out?
tradingwithrayner
Member
- Joined
- Apr 15, 2013
- Messages
- 383
- Reaction score
- 0
Hi Rayner,
Cheers for helping out new traders.
I've been tracking your trades.
They seem to be mostly losses, but I may be wrong because you don't show the historical or live trades on your chart like this one.
Can you post your historical and live trades plotted on your chart as below so we know where you got in and got out?
Hi there,
Yes you're right i win about 40% of the time in fact.
I do get losses and i rely on my large wins to cover these small losses.
I've shared with the viewers openly on my thought process before each trades are executed, so that's the best source for you to find out.
Sorry i'm not here to provide any signal service but simply an avenue for me to share and help developing traders think on their feet.
No offense here at all
Cheers!
Last edited:
tradingwithrayner
Member
- Joined
- Apr 15, 2013
- Messages
- 383
- Reaction score
- 0
I figured you're hoping to see something like this

Does those green and red lines mean anything?
I feel its much more beneficial to understand my thought process before a trade rather than simply knowing where i enter or exit.
I hope you can see where i'm coming from")
Rayner
Does those green and red lines mean anything?
I feel its much more beneficial to understand my thought process before a trade rather than simply knowing where i enter or exit.
I hope you can see where i'm coming from
Rayner
Last edited:
Knight_Rider
Arch-Supremacy Member
- Joined
- Apr 30, 2003
- Messages
- 11,100
- Reaction score
- 1

The FTSE is fast heading towards a level of resistance – no less than the pen-ultimate level to its all-time-high of 6950 (last tested in January 2000). Getting ready for a sell set-up at 14 Year High for FTSE100 Rayner on the triple top?
Spectre of 1929 crash looms over FTSE 100 as traders take on record debts - Telegraph
Trade Closed
 I was hoping to see charts like this. This really helps readers to understand. Entry, Exits and why the trades were taken are all important, glossing over charts and talking in general terms leaves me with questions.
Here we see a reverse head and shoulder pattern with breakout confirmation. Trade was scaled out in 3 portions and Stop moved to break even for the final portion of the trade. This was a USDJPY live trade. My apologies for the small imgae.
Here we see a reverse head and shoulder pattern with breakout confirmation. Trade was scaled out in 3 portions and Stop moved to break even for the final portion of the trade. This was a USDJPY live trade. My apologies for the small imgae.
Last edited:
Live AUDUSD Trade
Well talking about charts in hindsight is easy. We can all talk like experts in hindsight. Here is a live AUDUSD trade. You can see the market gapped down on open. However, it quickly covered the gap and made higher highs and higher lows. I bought on a dip. Let's see how this plays out. I will be scaling out and moving to break even on the final leg of the trade. If it gets that far

Well talking about charts in hindsight is easy. We can all talk like experts in hindsight. Here is a live AUDUSD trade. You can see the market gapped down on open. However, it quickly covered the gap and made higher highs and higher lows. I bought on a dip. Let's see how this plays out. I will be scaling out and moving to break even on the final leg of the trade. If it gets that far
I figured you're hoping to see something like this
Does those green and red lines mean anything?
I feel its much more beneficial to understand my thought process before a trade rather than simply knowing where i enter or exit.
I hope you can see where i'm coming from
Rayner
Surely the entries and exits are just as important as the thought process behind the trade?
tradingwithrayner
Member
- Joined
- Apr 15, 2013
- Messages
- 383
- Reaction score
- 0
Surely the entries and exits are just as important as the thought process behind the trade?
No offense here but i don't see how a chart filled with entries and exits could illustrate what a trader is thinking.
Green is buy red is exit.
Why did he buy and why did he exit?
It will only leave people guessing.
I'd rather share my thought process on how i will trade a product through a video as i tend to flip from a higher timeframe down to the next.
Getting stopped out of a trade is a norm to me and simply the cost of doing business. Not many can relate to it and i don't blame them.
There's more to be learnt from than simply green and red lines on a chart.
This is how i intend to keep things moving forward, i hope you can appreciate that.
Cheers!
Important Forum Advisory Note
This forum is moderated by volunteer moderators who will react only to members' feedback on posts. Moderators are not employees or representatives of HWZ Forums. Forum members and moderators are responsible for their own posts.
Please refer to our Community Guidelines and Standards and Terms and Conditions for more information.