psychology of trading

stanlawj

Supremacy Member
Joined
Jul 11, 2021
Messages
7,856
Reaction score
4,232
How to do this? Use algos to find correlations?

I think sector rotation by institutions can be used by scanning various indices for the highest growth then look for patterns within various component stocks.
My method for my mining stocks would be to use the correlation coefficient (tradingview indicator) or visual comparison for price candlestick, especially with IWM and major commodity USD currency crosses (CNH, CAD, AUD). They all become correlated tightly during a legit sell-off (reliable exit signal). Indicators are always laggy, so I just look at price action most of the time.

The last two weeks saw carnage in many small cap mining stocks (other than gold producers) that delivered serious irrecoverable damage.
 
Last edited:

theMKR

Banned
Joined
Nov 3, 2016
Messages
70,999
Reaction score
13,609
A contribution regarding PRICE ACTION: Most people think that price action means just trying to study the candlestick, volume to determine the buy or sell signal. I found out that is the novice mindset, and seldom I find alpha here over longer durations.

Actually the key is INTERMARKET ANALYSIS: studying price action not just multiple time frames, but in multiple asset classes, and comparing their price action to look for possible relationships.

Easiest to explain: eg. gold mining stock
Study price action of both mining stock and spot gold. One can lead the other or lag the other, and the leads and lags are clues.

A simple observation from Stan Weinstein is that the SECTOR performance contributes alot to the performance of the stock. So studying the price action of the GDX gives further clues of how a gold mining stock might perform. So that leads to the "bullish percent gold miners index" as a high probability top or bottom indicator.

Another example: IWM and REM often leads SP500. Instead of trying to be fixated on just SP500, look at what is the price action of IWM and REM and then use that to confirm price action anaysis of SP500. Further slicing the index according to FACTOR STYLES (eg. growth vs value) and studying the price action to look for rotation within the index.


In short: it's not the price action that matters most, it's the relationship between the price action from different correlated assets that matters most to find out what's the motivation of buyers and sellers.
Basically trying to decode what the portfolio managers as an aggregate are doing (who cannot be 100% cash, so when they rebalance their portfolio, their adds and subtracts create the buying and selling pressure).
covariance analysis is super difficult.

in fact, the complexity is exponential, as the number of stocks you want to compare increases. most ppl see covariance matrix already head spinning :spin:
 

stanlawj

Supremacy Member
Joined
Jul 11, 2021
Messages
7,856
Reaction score
4,232
covariance analysis is super difficult.

in fact, the complexity is exponential, as the number of stocks you want to compare increases. most ppl see covariance matrix already head spinning :spin:
I think we don't have to reinvent the wheel, if someone has already done the bulk of the work at sector level.
What_Works_In_Each_Quad.png


Since I primarily use price-action, I haven't seen any proper use of covariance stats to get trading edge, so my knowledge will be just as above.
 
Last edited:

theMKR

Banned
Joined
Nov 3, 2016
Messages
70,999
Reaction score
13,609
I think we don't have to reinvent the wheel, if someone has already done the bulk of the work at sector level.
What_Works_In_Each_Quad.png


Since I primarily use price-action, I haven't seen any proper use of covariance stats to get trading edge, so my knowledge will be just as above.
i tot price action can use covariance also?
 

stanlawj

Supremacy Member
Joined
Jul 11, 2021
Messages
7,856
Reaction score
4,232
i tot price action can use covariance also?
Isn't the distinctive feature of price action is that it only uses the most recent candlesticks, so it doesn't use historical prices? 2-candlestick, 3-candlestick patterns ?
But to calculate covariance, you need historical prices over longer duration over weeks at least. I don't know if calculating covariance just using intraday prices is actually meaningful.

https://www.investopedia.com/terms/c/covariance.asp
Then covariance result for stocks will just be the table I just posted above. But it still isn't complete, because covariance can't give you timing signals. My point is to use price action across multiple asset classes to do timing. Eg. BTC and QQQ tends to move in the same direction during true bull impulse moves. Two days ago, BTCUSD just broke out with an impulse bull move, but if QQQ doesn't confirm with a impulse bull move, then BTCUSD is likely to be a bull trap. If I bought BTCUSD on breakout, I will sell at the end of the bull candlebar and not try to do trendfollow (trailing stop loss), because this may be the last bull candlebar.
 
Last edited:

theMKR

Banned
Joined
Nov 3, 2016
Messages
70,999
Reaction score
13,609
Isn't the distinctive feature of price action is that it only uses the most recent candlesticks, so it doesn't use historical prices? 2-candlestick, 3-candlestick patterns ?
But to calculate covariance, you need historical prices over longer duration over weeks at least. I don't know if calculating covariance just using intraday prices is actually meaningful.

https://www.investopedia.com/terms/c/covariance.asp
Then covariance result for stocks will just be the table I just posted above. But it still isn't complete, because covariance can't give you timing signals. My point is to use price action across multiple asset classes to do timing. Eg. BTC and QQQ tends to move in the same direction during true bull impulse moves. Two days ago, BTCUSD just broke out with an impulse bull move, but if QQQ doesn't confirm with a impulse bull move, then BTCUSD is likely to be a bull trap. If I bought BTCUSD on breakout, I will sell at the end of the bull candlebar and not try to do trendfollow (trailing stop loss), because this may be the last bull candlebar.
i usually do sliding window analysis to find price action that has "delay". but so far no luck.
 

rider83

Arch-Supremacy Member
Joined
Jun 13, 2007
Messages
10,561
Reaction score
4,614
Very interesting thread and some of u really offer good advice.
 

stanlawj

Supremacy Member
Joined
Jul 11, 2021
Messages
7,856
Reaction score
4,232
i usually do sliding window analysis to find price action that has "delay". but so far no luck.
My point just turned out correct. BTC price action is correlated to QQQ. BTC just fully reversed the 10th Apr jump from 28.4k to 30.5k since QQQ failed to break out that same week. Price action analysis more reliable if tied with correlated markets. Currently this correlation is holding due to the move driven by same liquidity factor.
 
Last edited:

stanlawj

Supremacy Member
Joined
Jul 11, 2021
Messages
7,856
Reaction score
4,232
This probably is a good time to say this:

If you've missed a good stock, don't fret about it. With thousands of listed stocks to pick from, if you miss the first one, another one will soon come along.
— Stan Weinstein
 

jinsatkilife

Senior Member
Joined
May 4, 2019
Messages
1,752
Reaction score
1,827
This probably is a good time to say this:

If you've missed a good stock, don't fret about it. With thousands of listed stocks to pick from, if you miss the first one, another one will soon come along.
— Stan Weinstein
would be nice if there's trade ideas or calls/trades u make so we can debate the pros/cons
 

stanlawj

Supremacy Member
Joined
Jul 11, 2021
Messages
7,856
Reaction score
4,232


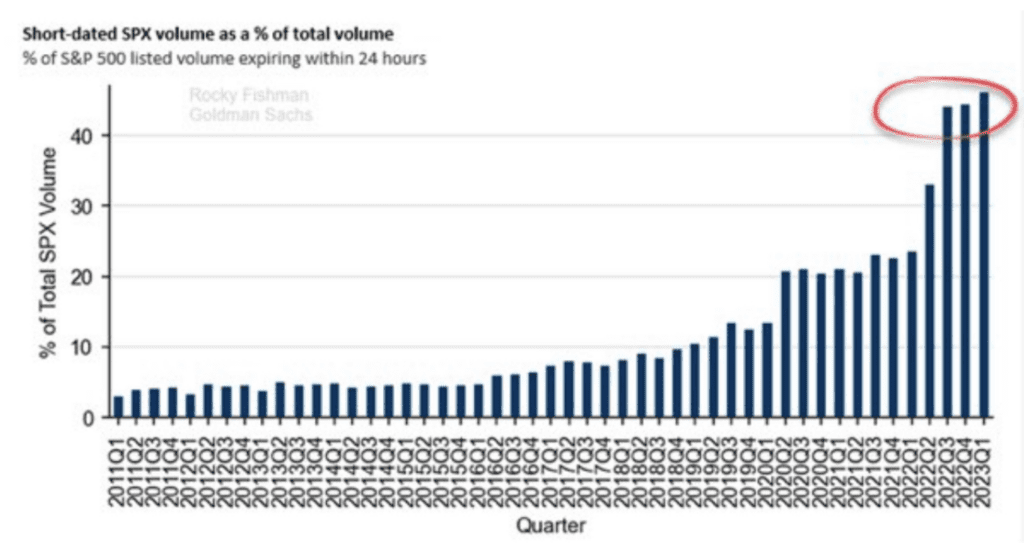
Today's market is manipulated by institutions using options. For index, 0dte option is used.

Screenshot-2023-01-27-at-11.26.02-AM-1024x543.png
 
Last edited:

stanlawj

Supremacy Member
Joined
Jul 11, 2021
Messages
7,856
Reaction score
4,232
So far, nothing has changed since my last posting here. Options and 0dte is used to push US market indexes.

More important, are you making money???

Chicken Genius shows his psychology:
stick to what he knows best, bet big where he has an edge (and cut loss to keep losses small?).

 
Last edited:

stanlawj

Supremacy Member
Joined
Jul 11, 2021
Messages
7,856
Reaction score
4,232
July - Nov 2023
ITPM students show their performance stats.
(HINT: approach it with the mindset it is a business)

 
Last edited:

stanlawj

Supremacy Member
Joined
Jul 11, 2021
Messages
7,856
Reaction score
4,232
Previously, i stated that TA alone cannot guarantee success, especially for longer term positions and larger moves, and one needs information outside the chart.

Here's the evidence from someone who crossed from institution to prop trading.


What's covered: Regional banking crisis, Bitcoin, MSTR, China ADRs (BABA), PYPL, NVDA
 
Last edited:

stanlawj

Supremacy Member
Joined
Jul 11, 2021
Messages
7,856
Reaction score
4,232
Thanks to someone who recommended Mark Douglas' writing.
From The Disciplined Trader:

What it cost him personally to change:

embed


Trading errors:

embed


Skills to be learnt:
embed
 

stanlawj

Supremacy Member
Joined
Jul 11, 2021
Messages
7,856
Reaction score
4,232
This is a very rare interview demonstrating Swing Trading vs Position Trading and how one should mentally approach or transition between the two.

Position trading over years is the equivalent of long-term investing. Highly recommended for all long-term investors, because they sometimes buy stocks that are only suitable for swing trading, and don’t realise that so they end up bagholding.


With regards to profit-taking, I don’t take partials, but use profits from previous trades as risk capital for future trades. Hence, unlike this trader, I have no need to take partial sells until the profit target is reached.
 
Last edited:

stanlawj

Supremacy Member
Joined
Jul 11, 2021
Messages
7,856
Reaction score
4,232
Watch this. Learn not to baghold. It messes your head. Cut your losses and earn back quickly in other stocks.
Start from 30:05
 

sohguanh

Supremacy Member
Joined
Jul 10, 2010
Messages
8,886
Reaction score
3,013
Watch this. Learn not to baghold. It messes your head. Cut your losses and earn back quickly in other stocks.
For normal stocks etfs yes for me. But if it is S-Reit I hold on long term as I want their 0 tax passive income feature.
 

stanlawj

Supremacy Member
Joined
Jul 11, 2021
Messages
7,856
Reaction score
4,232
For normal stocks etfs yes for me. But if it is S-Reit I hold on long term as I want their 0 tax passive income feature.
Depends on when you buy the REITS and what REITS you buy.
If you bought those sampan REITS near the peak, then gone case.
 
Last edited:
Important Forum Advisory Note
This forum is moderated by volunteer moderators who will react only to members' feedback on posts. Moderators are not employees or representatives of HWZ. Forum members and moderators are responsible for their own posts.

Please refer to our Community Guidelines and Standards, Terms of Service and Member T&Cs for more information.
Top